On the record · 2025 to now · Huridocs
Uwazi, pushing the limits of research
A prototype that turns Uwazi's Library into a research and OSINT tool. Every fact says who said it, and a researcher's questions get answered on one screen.
- When
- November 2025 to now
- For
- Huridocs
- Status
- Prototype, mock data, not shipped
Twenty questions
Uwazi stores evidence well. It is less good at answering questions about it. A researcher working on a protest, a court case or a shooting does not want a list of records. They want to know which sources support a claim and which dispute it, who held an office on a given day, what happened in one district over thirty hours, and what connects two people who were never in the same room.
So I started with the questions instead of the screens. Twenty of them, the way a researcher would ask, tested against a real corpus. The Library as it stood could answer five on one screen, nine by hand, and six not at all. The reasons repeated: a link's status and dates were stored and then thrown away, a place or a person could not be used as a filter, events had no place on the map, there was no path query, and nothing could be saved or cited at the end.
The answer was not more filters. It was to treat every link and every field as a claim with sources behind it, and build the Library around that.
Who says so
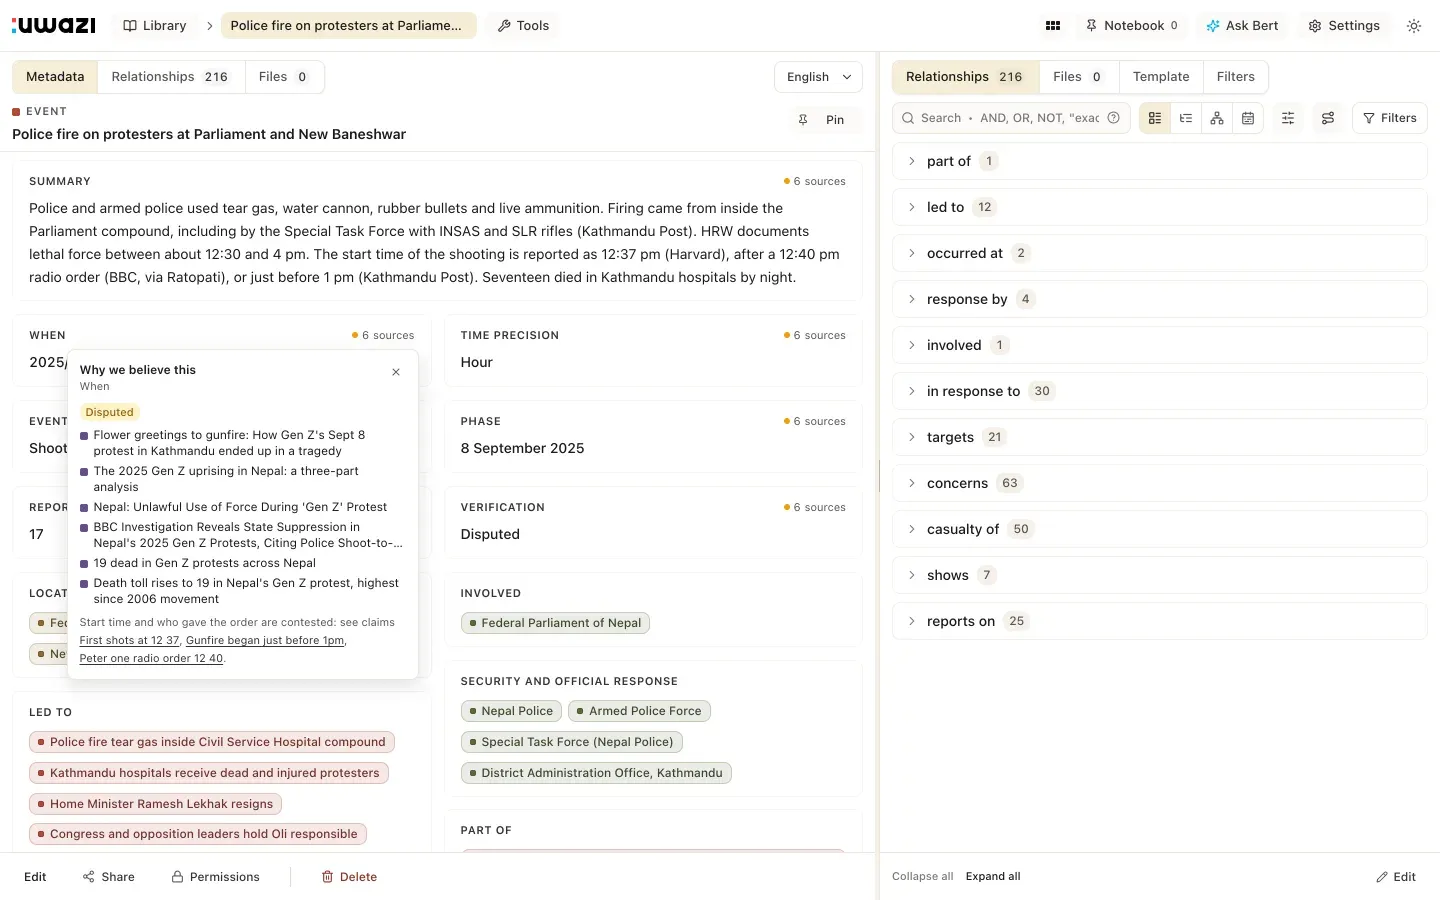
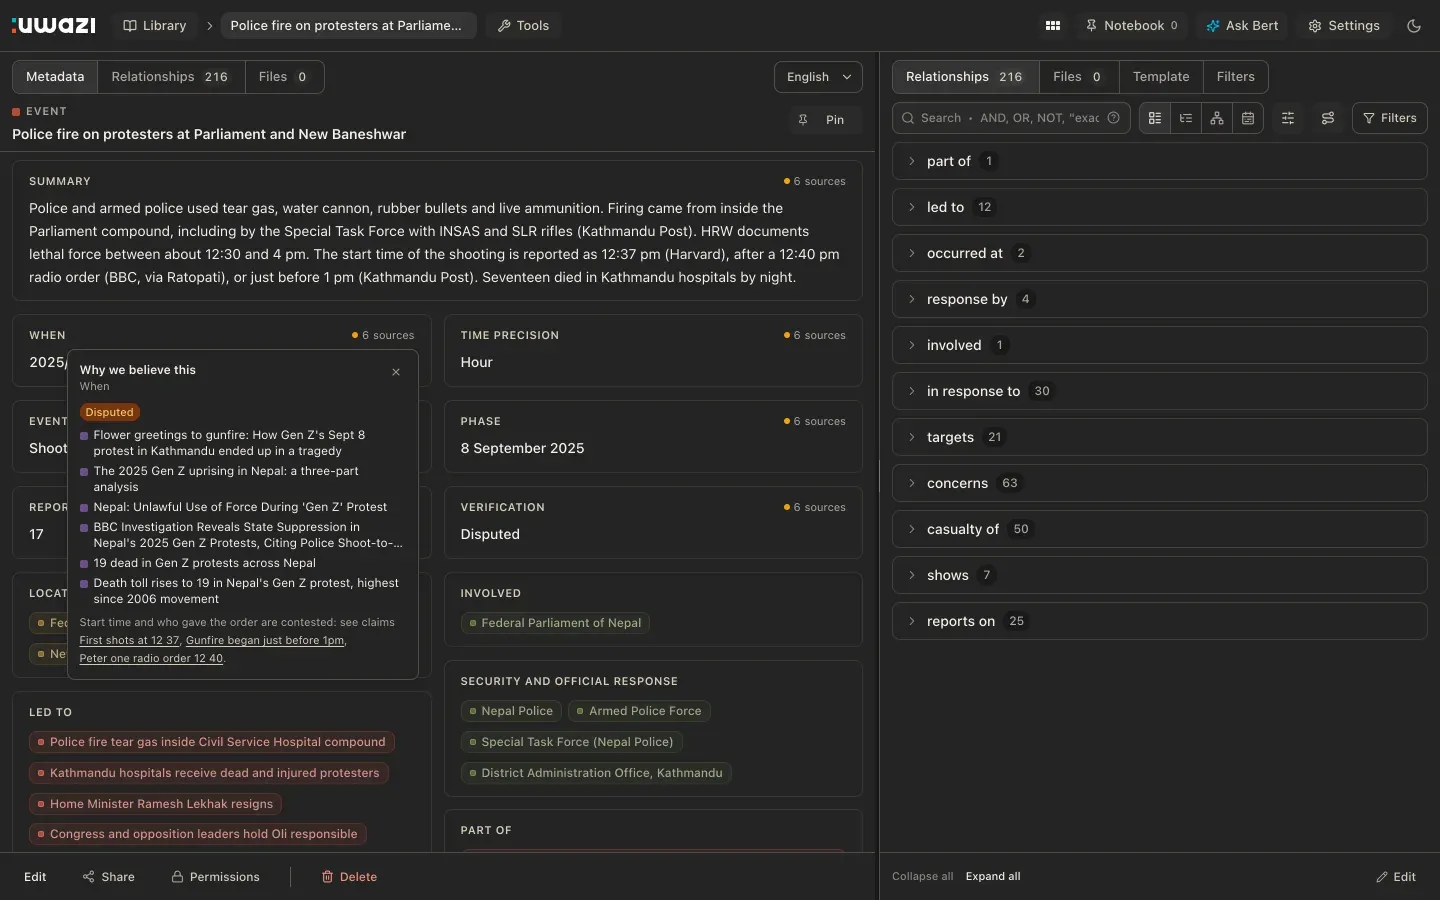
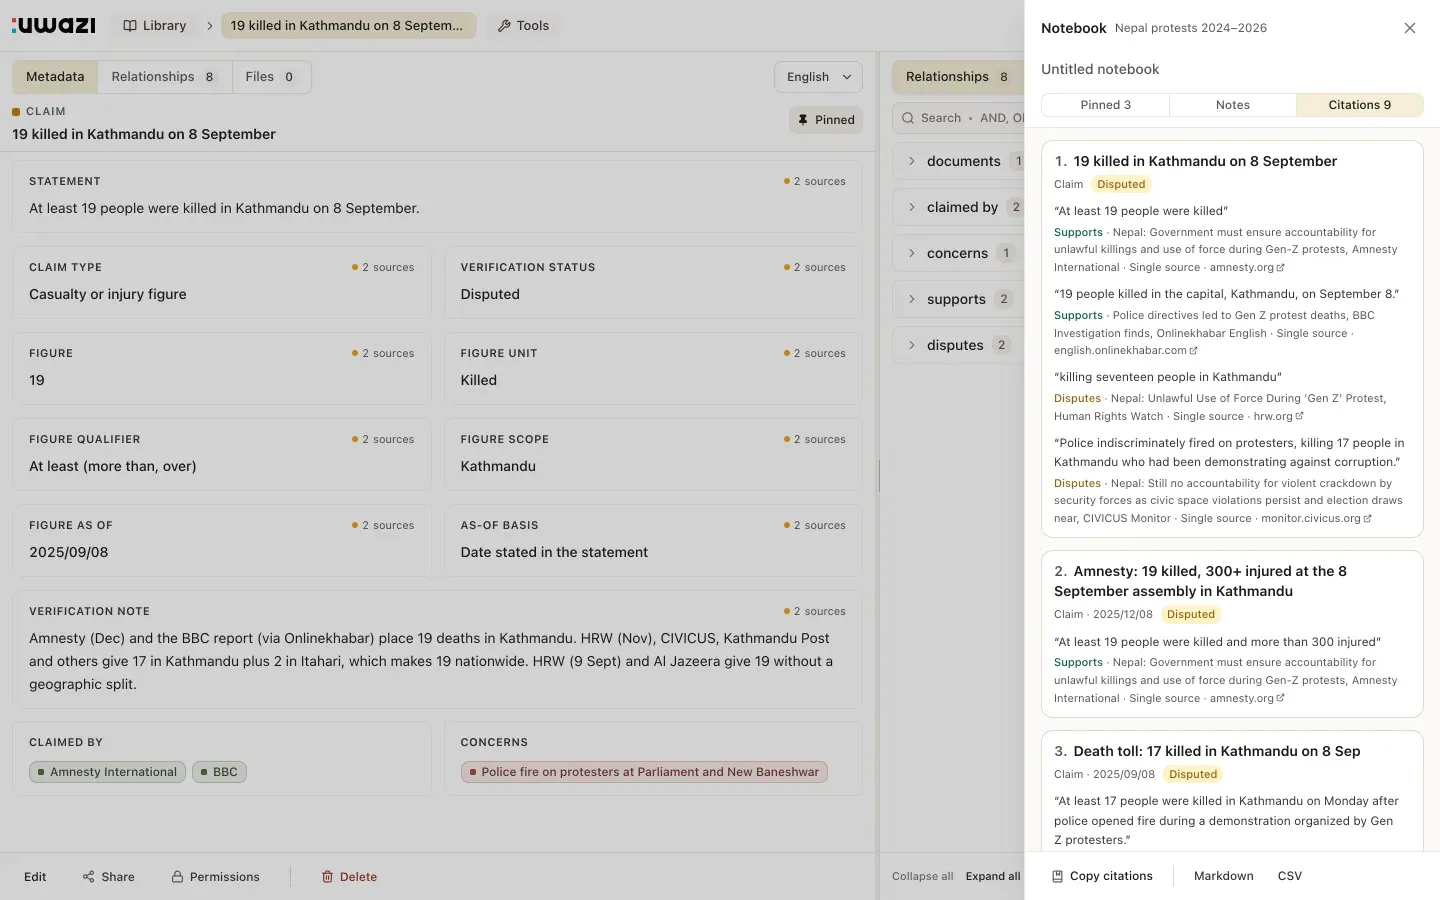
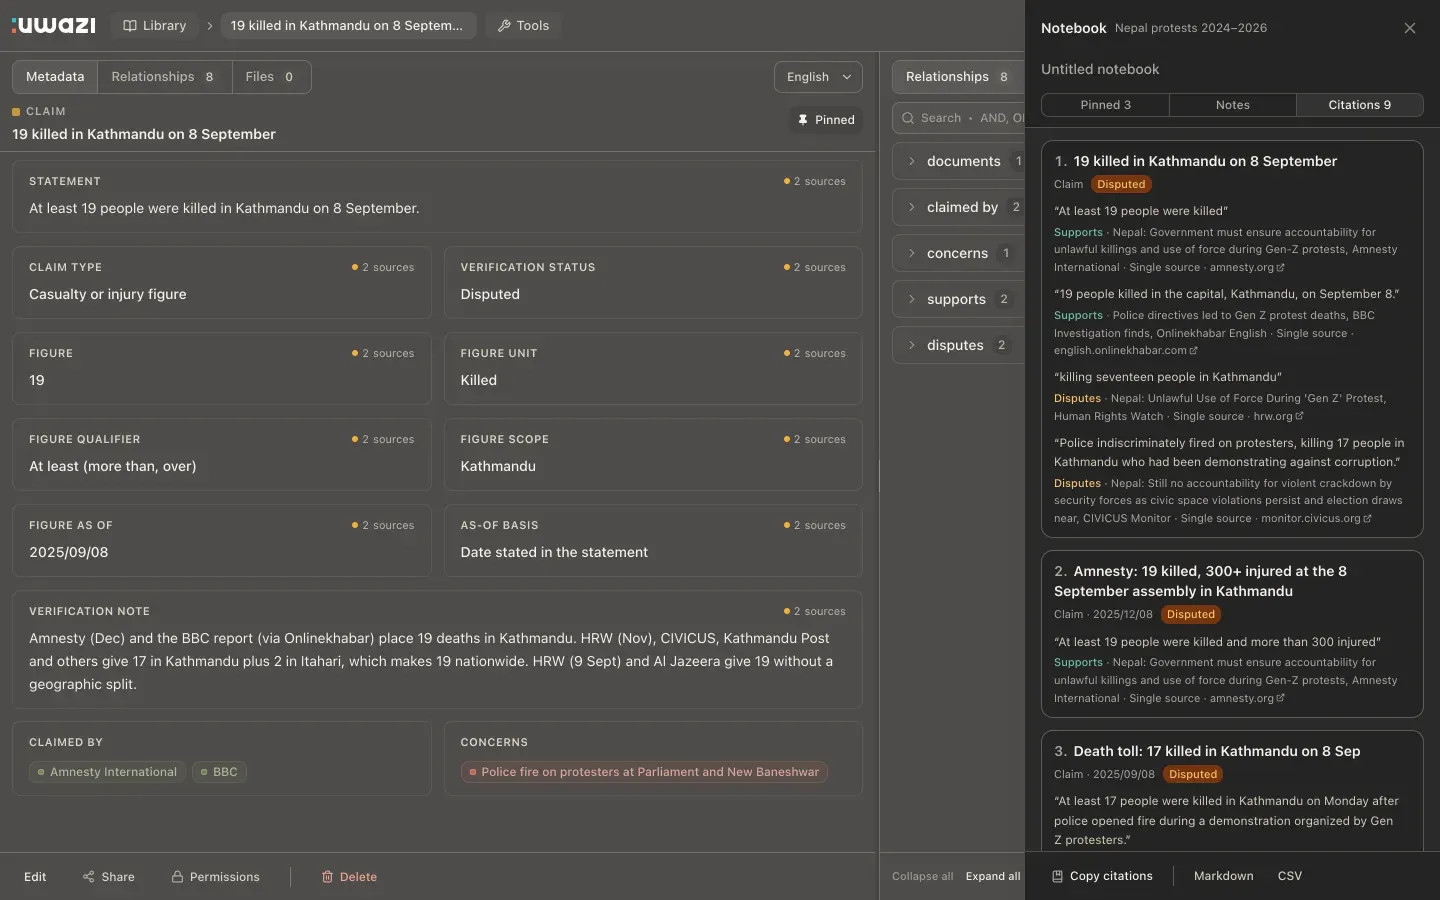
Every field now shows how many sources stand behind it. Open one and it says which publishers, what each of them wrote, and whether the value is confirmed, single-source or disputed. On a timed event the popover lists six sources and says the start time is contested.
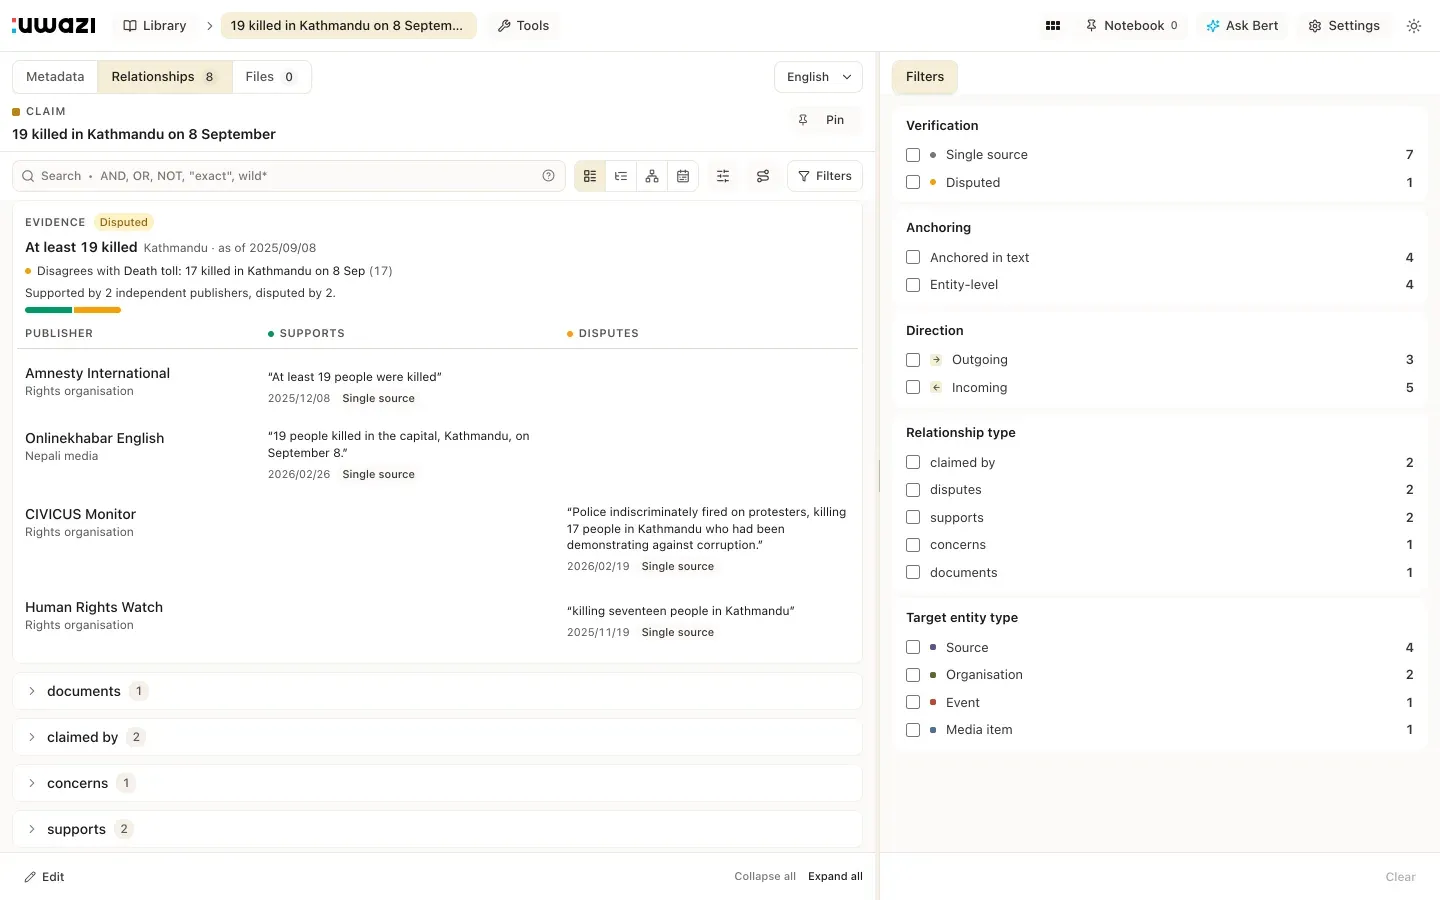
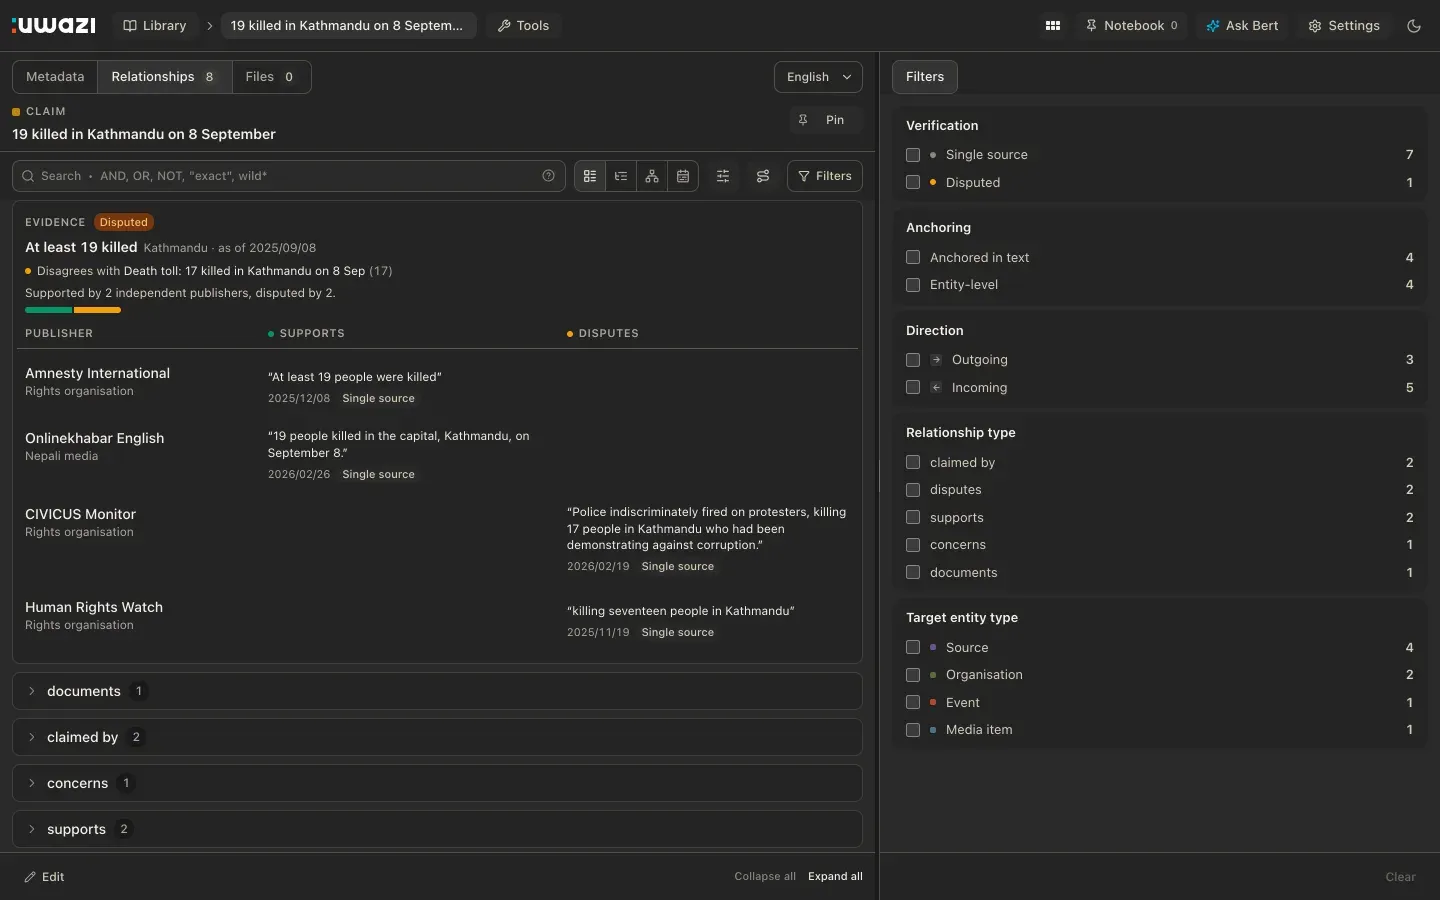
A claim opens on its evidence: publishers in rows, Supports and Disputes in columns, the quote in the cell with its date and status. Wire copies of the same story count once. A claim that counts the same thing as another says so, with the other figure next to it.
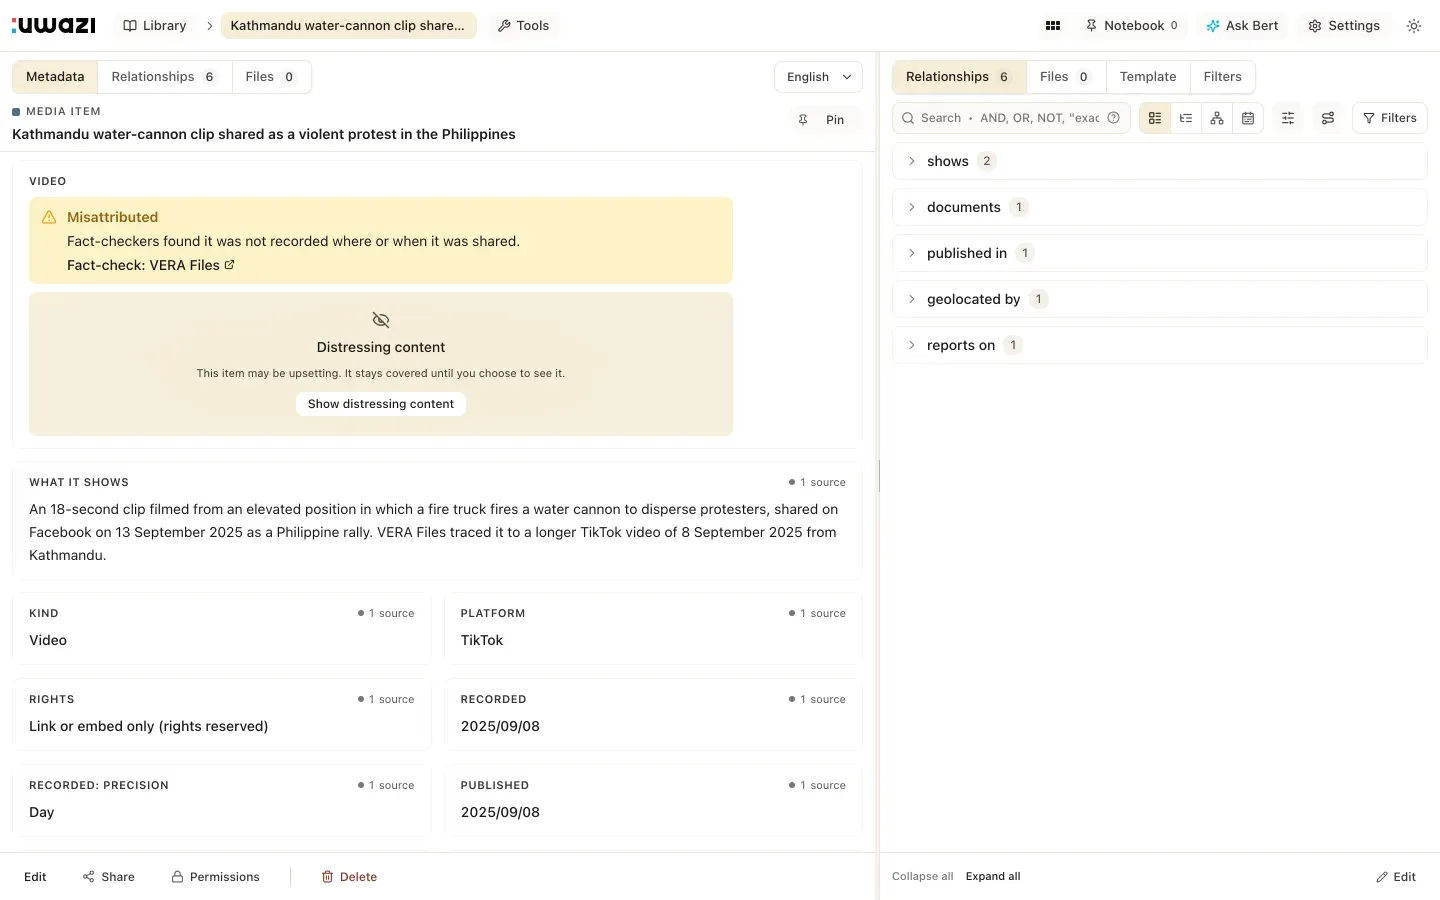
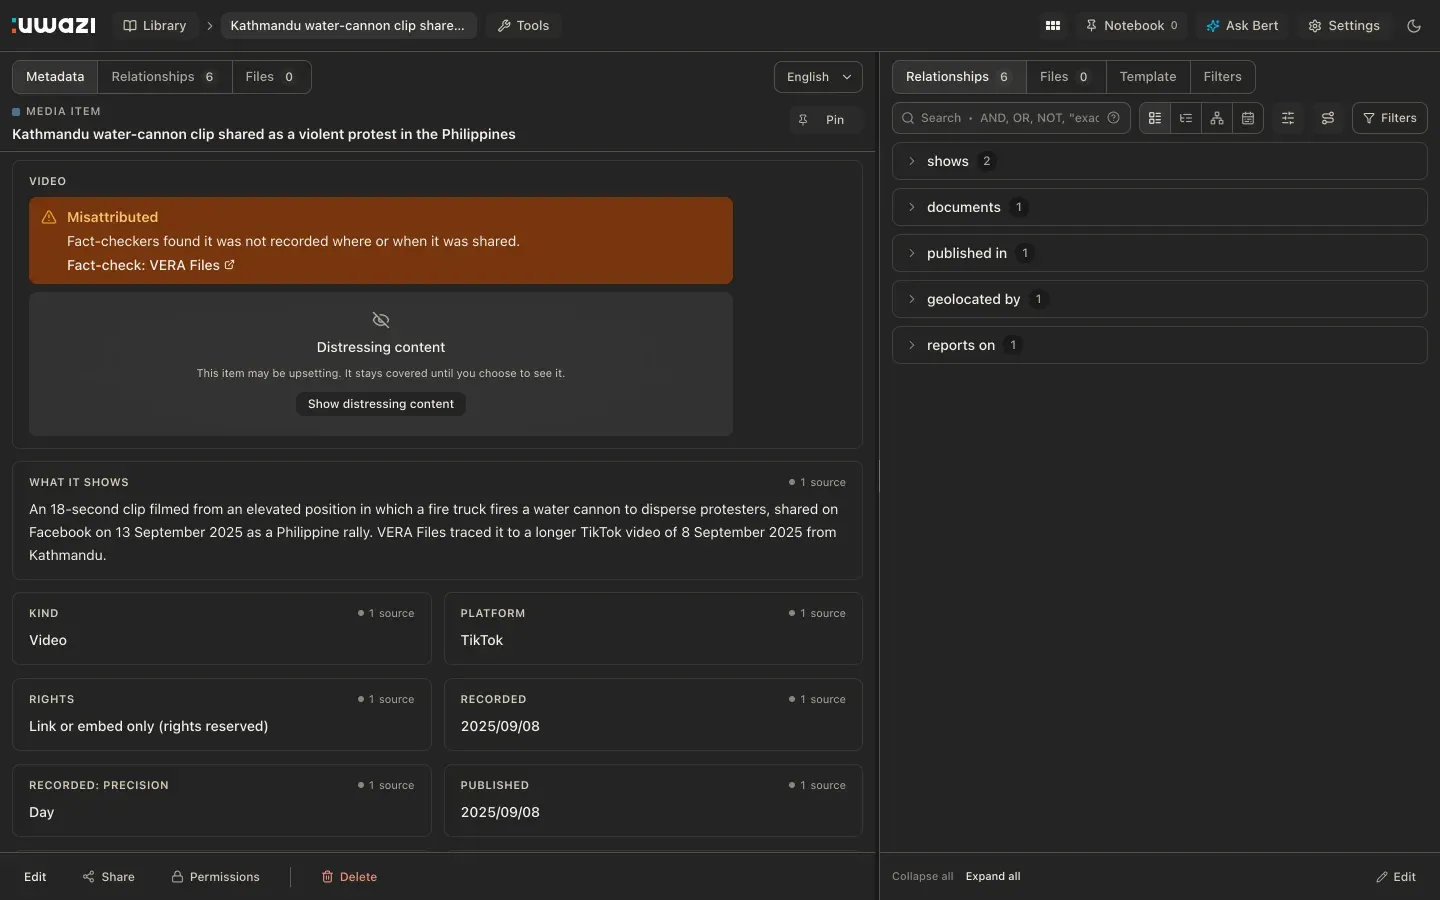
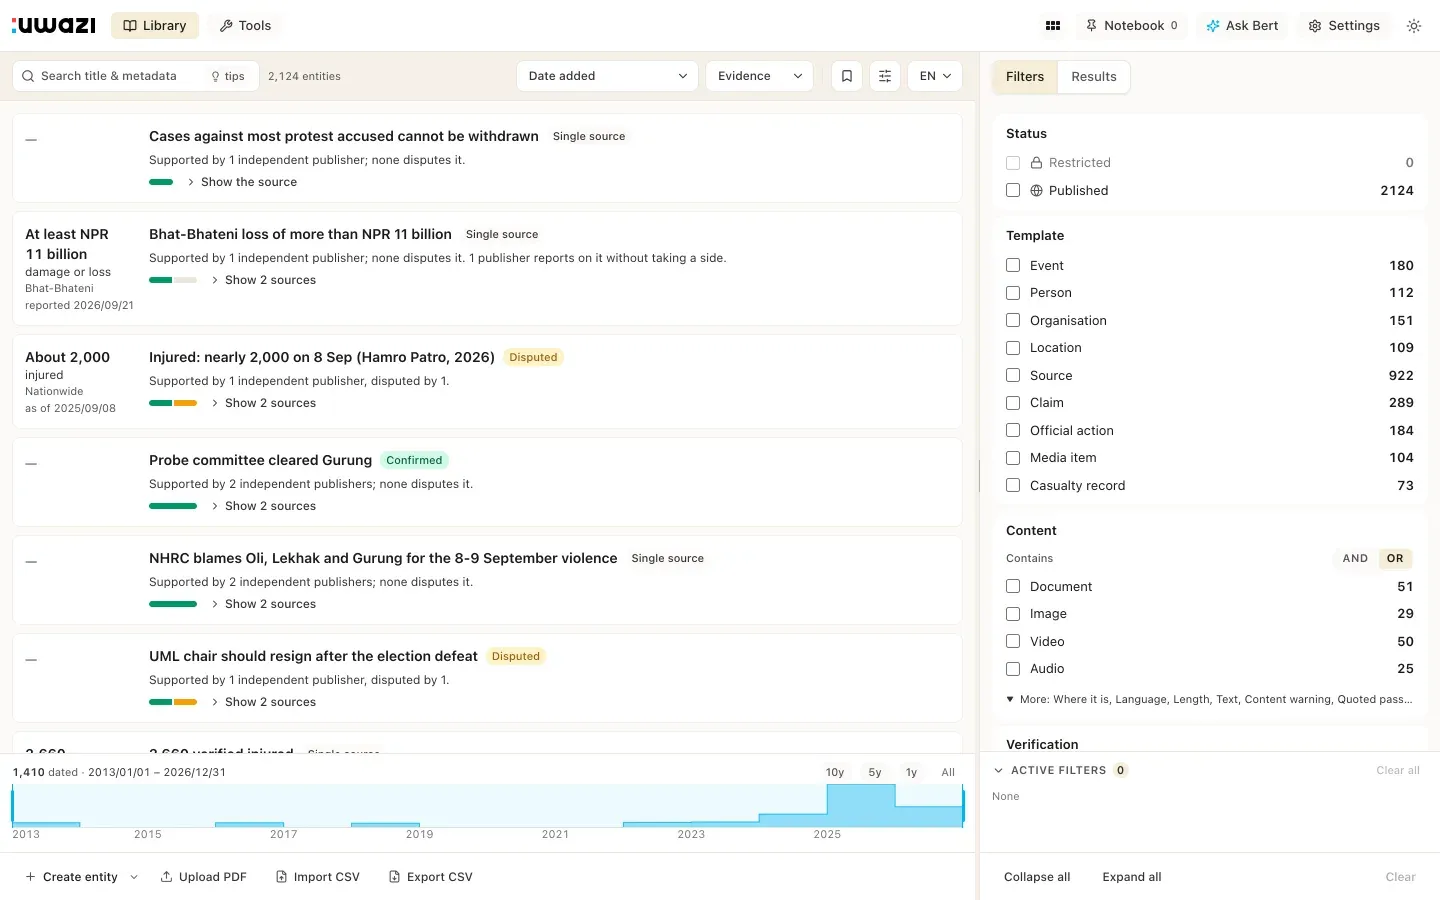
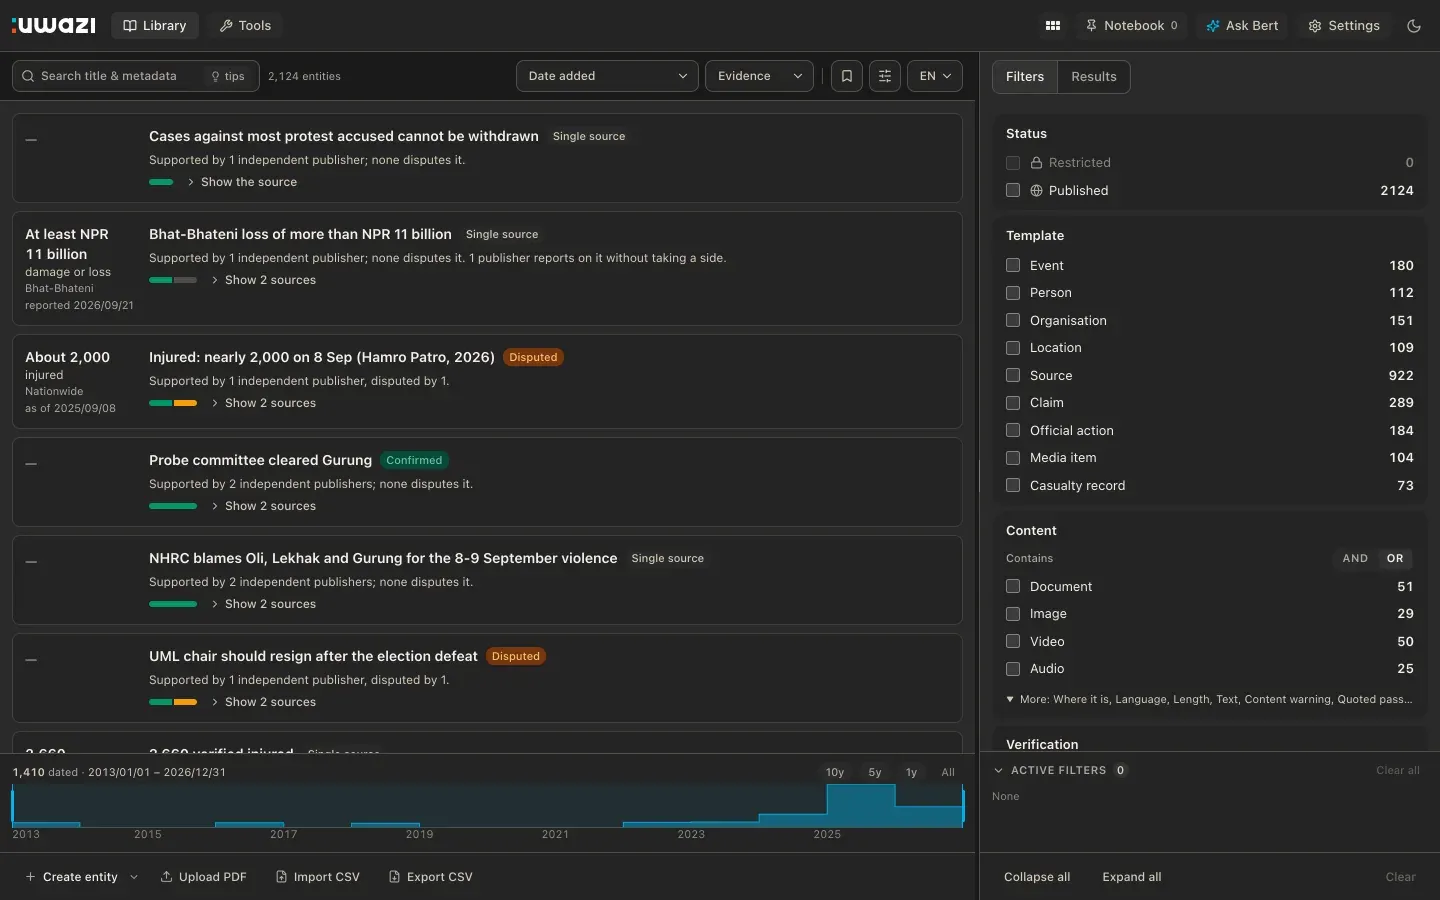
The Library has an Evidence view for the same idea across a whole collection: the figure in the left column, the claims it disagrees with, and a strength bar of supporting against disputing publishers. Footage that fact-checkers have traced elsewhere opens with a Misattributed note and keeps the distressing part covered until you choose to see it.
Where, who, when
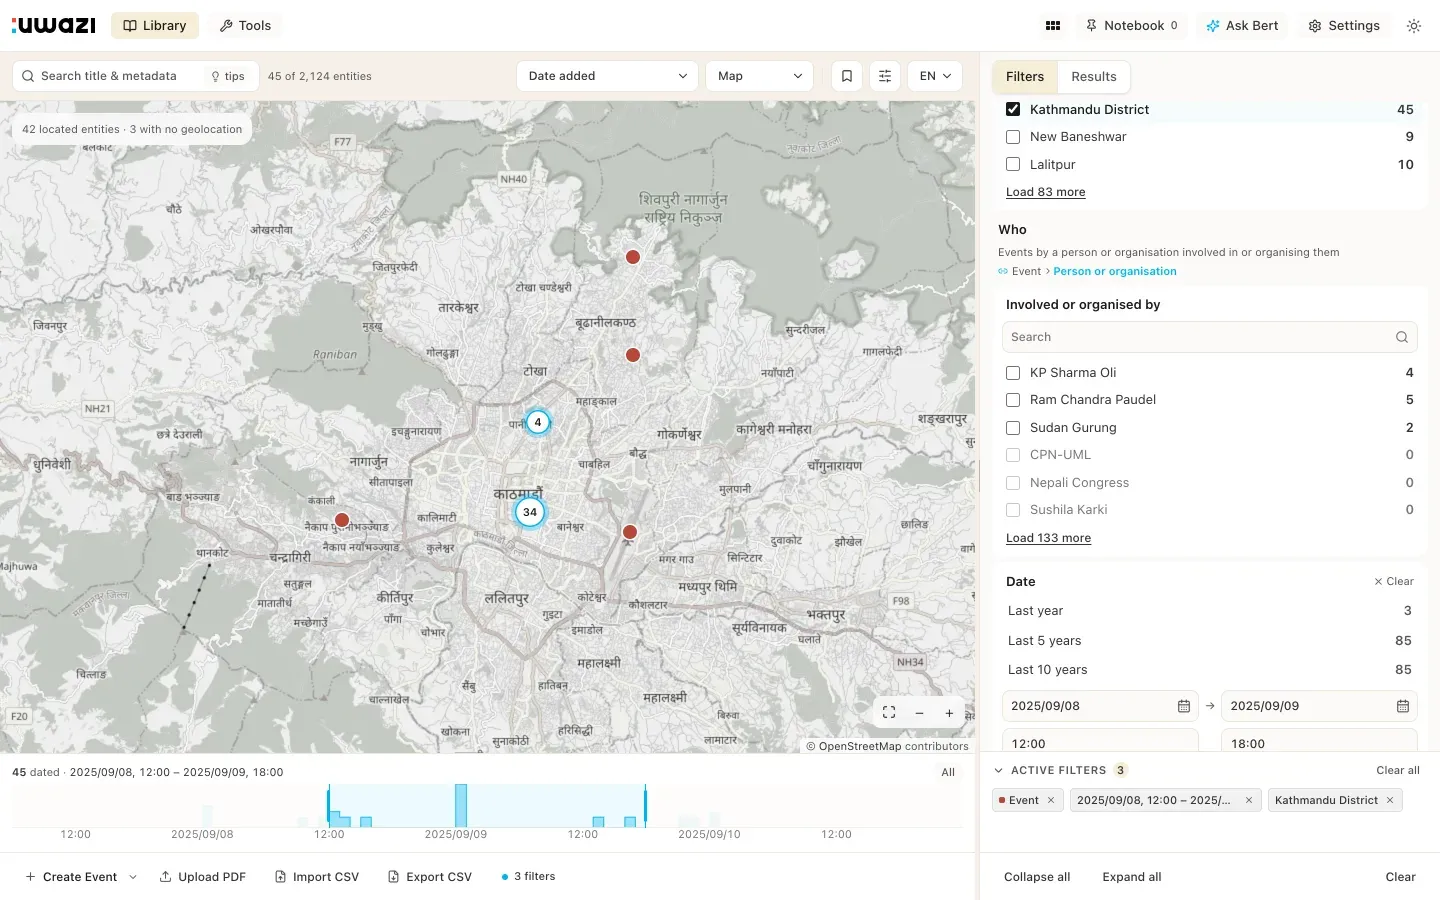
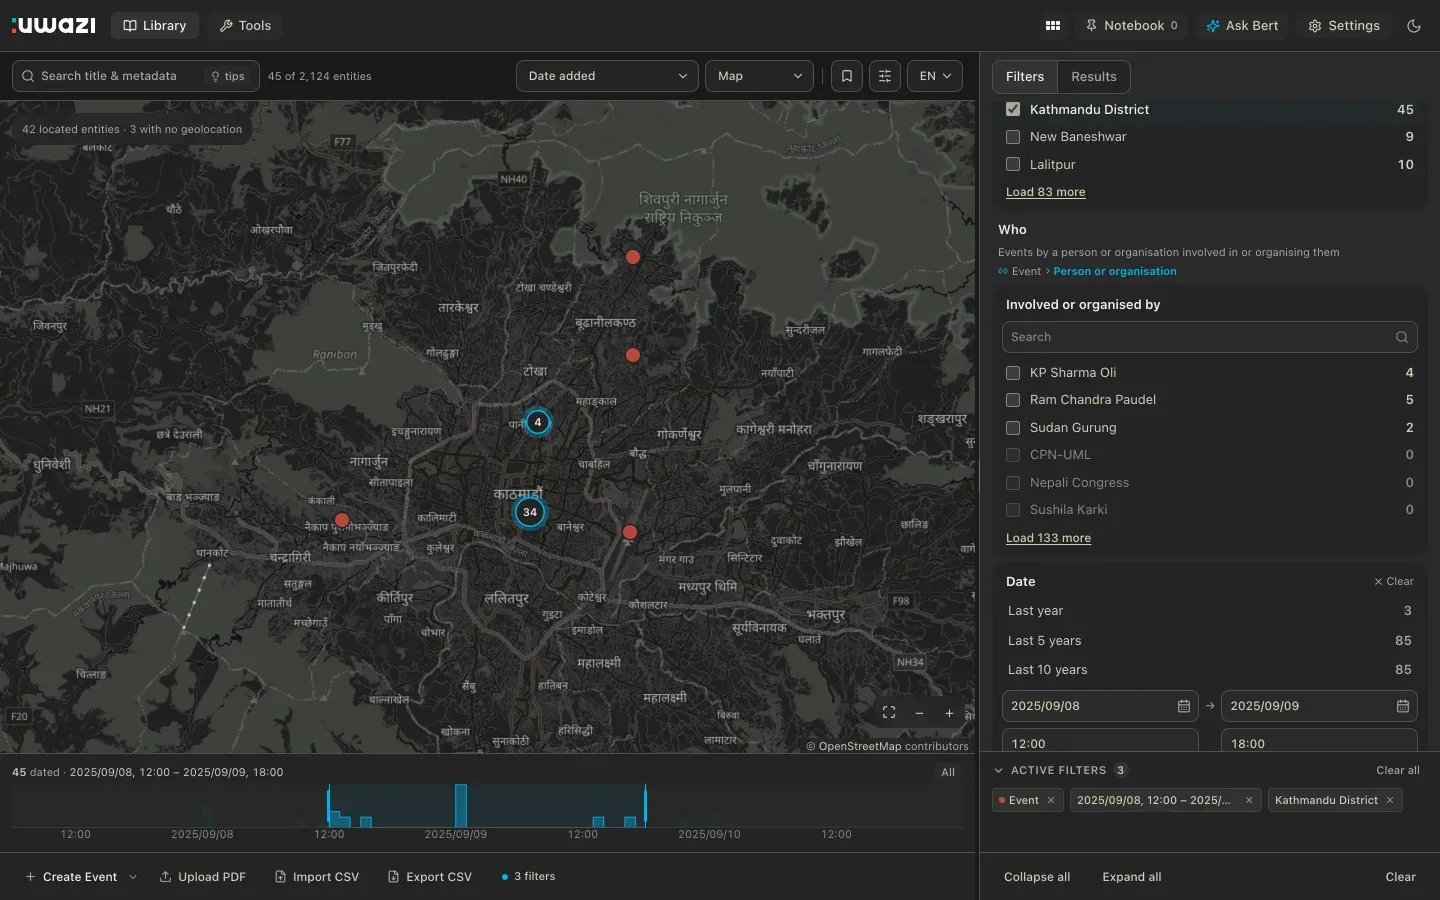
Filters used to be a flat set of checkboxes on the record's own fields. Now a filter can reach through a link: Event, then Where, then Kathmandu District returns the events that happened there or at any place inside it, and Who narrows the same set by the people and organisations involved. Each facet has a Match mode, any, all, none or missing, ranges where the data is numeric, and OR and NOT groups for the questions that need them.
Time and place are one view. The strip under the Library, the map and the list read the same filter, down to the hour where the data has it. Events take their place on the map from the location they happened at, so a district query draws as a district. A view can be saved and shared as a link.
What connects them
The old Relationships panel spent its controls on arranging rows. None of them said whether a link was confirmed, when it held or who reported it, and the data had all three on every reference. So every link now carries its status and its dates, the panel can be filtered by them, and an As of date answers who held what on a given day.
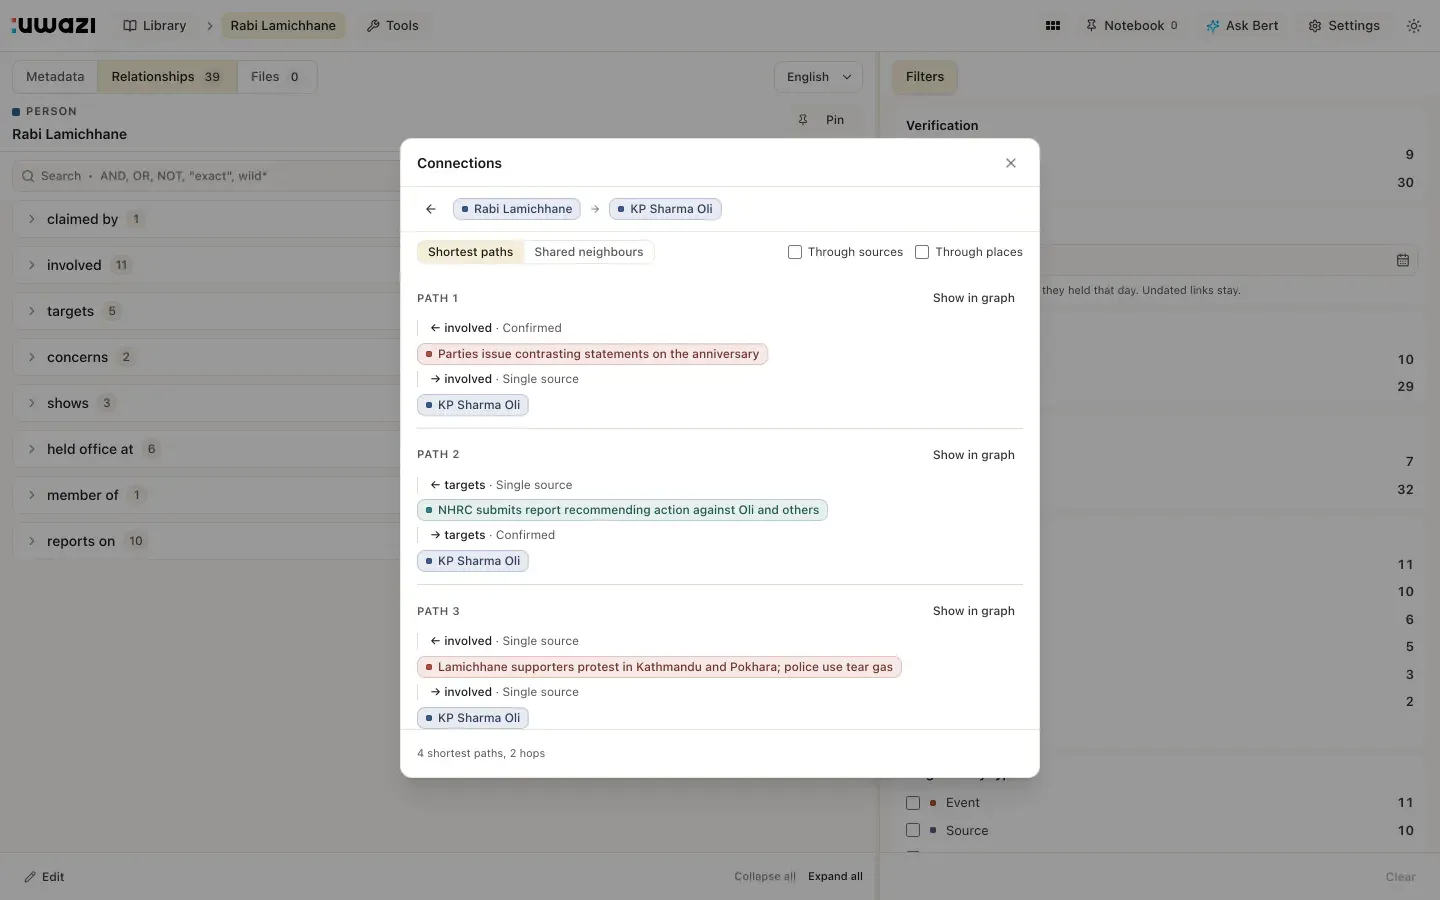
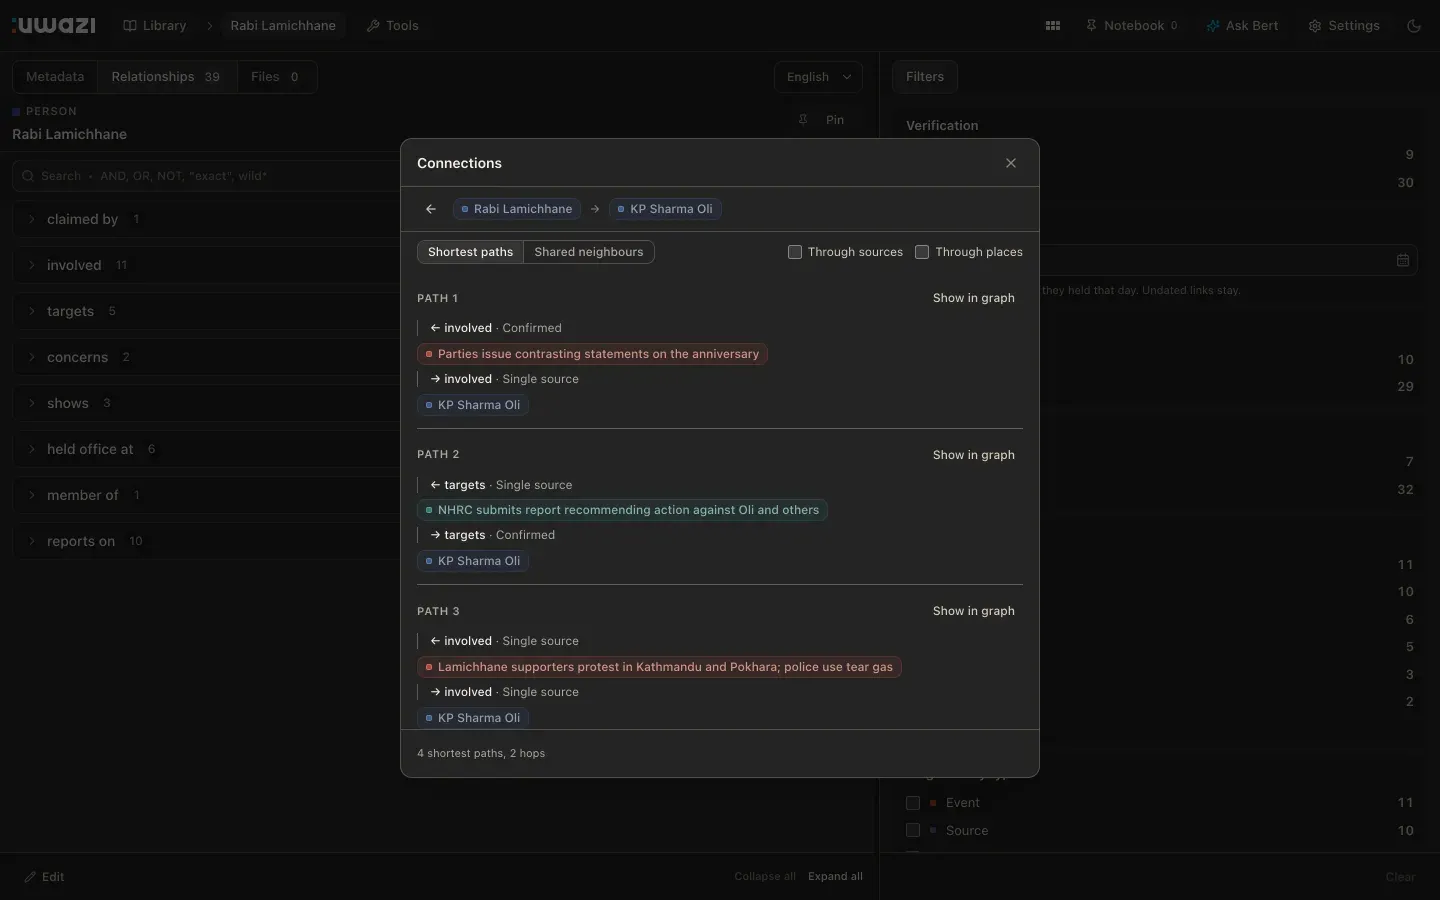
Connect to finds the shortest paths between two records and shows each hop with its status, so a path through a single-source link reads as weaker than one through confirmed ones. Sources and places are skipped as hops by default, because every path runs through Kathmandu otherwise. Shared neighbours is the second tab, and any path can be drawn over the graph.
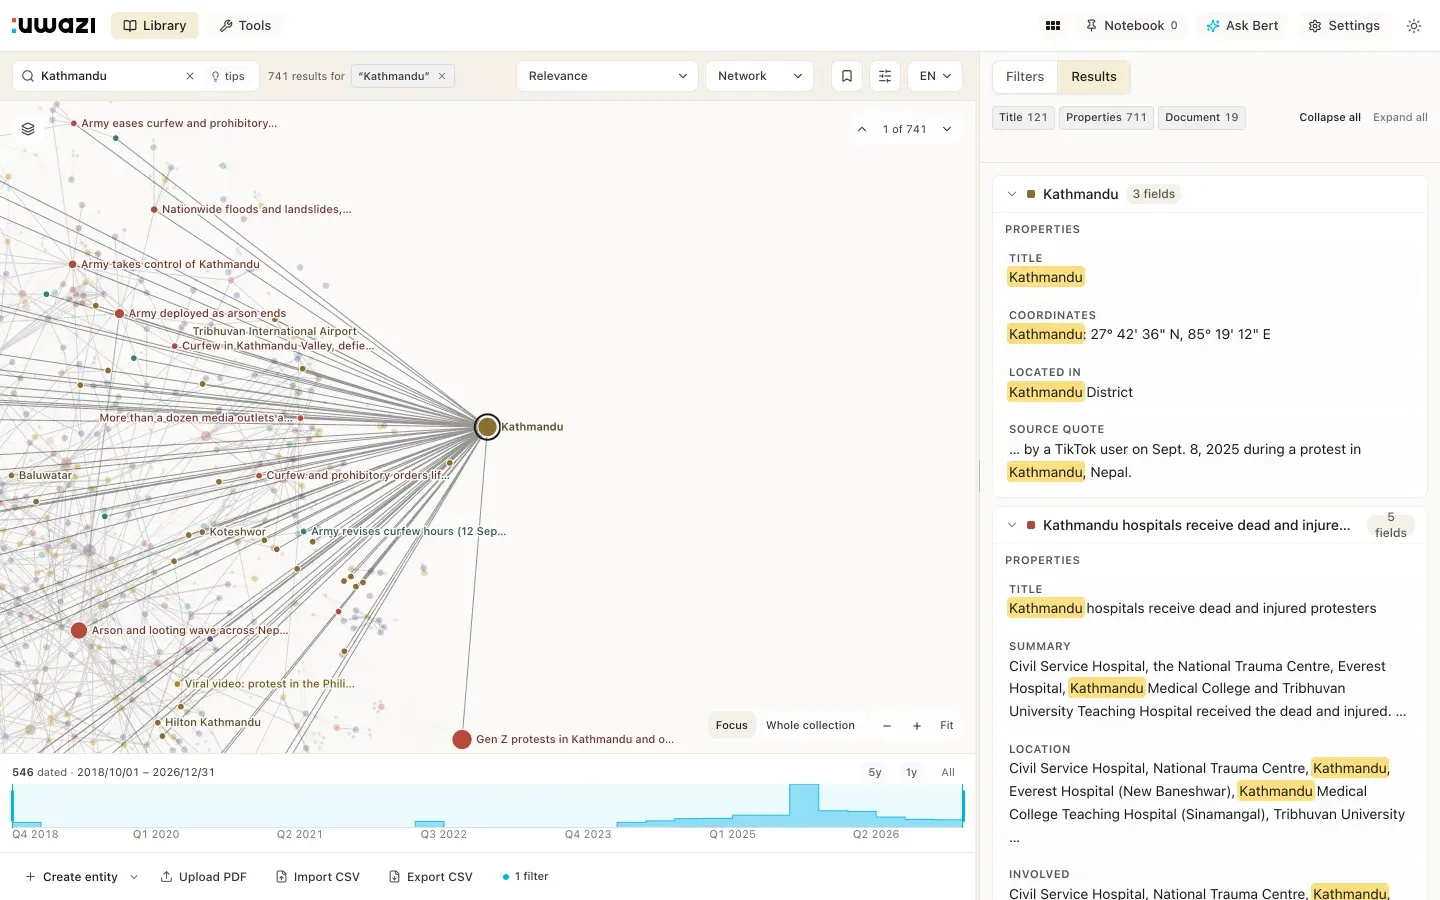
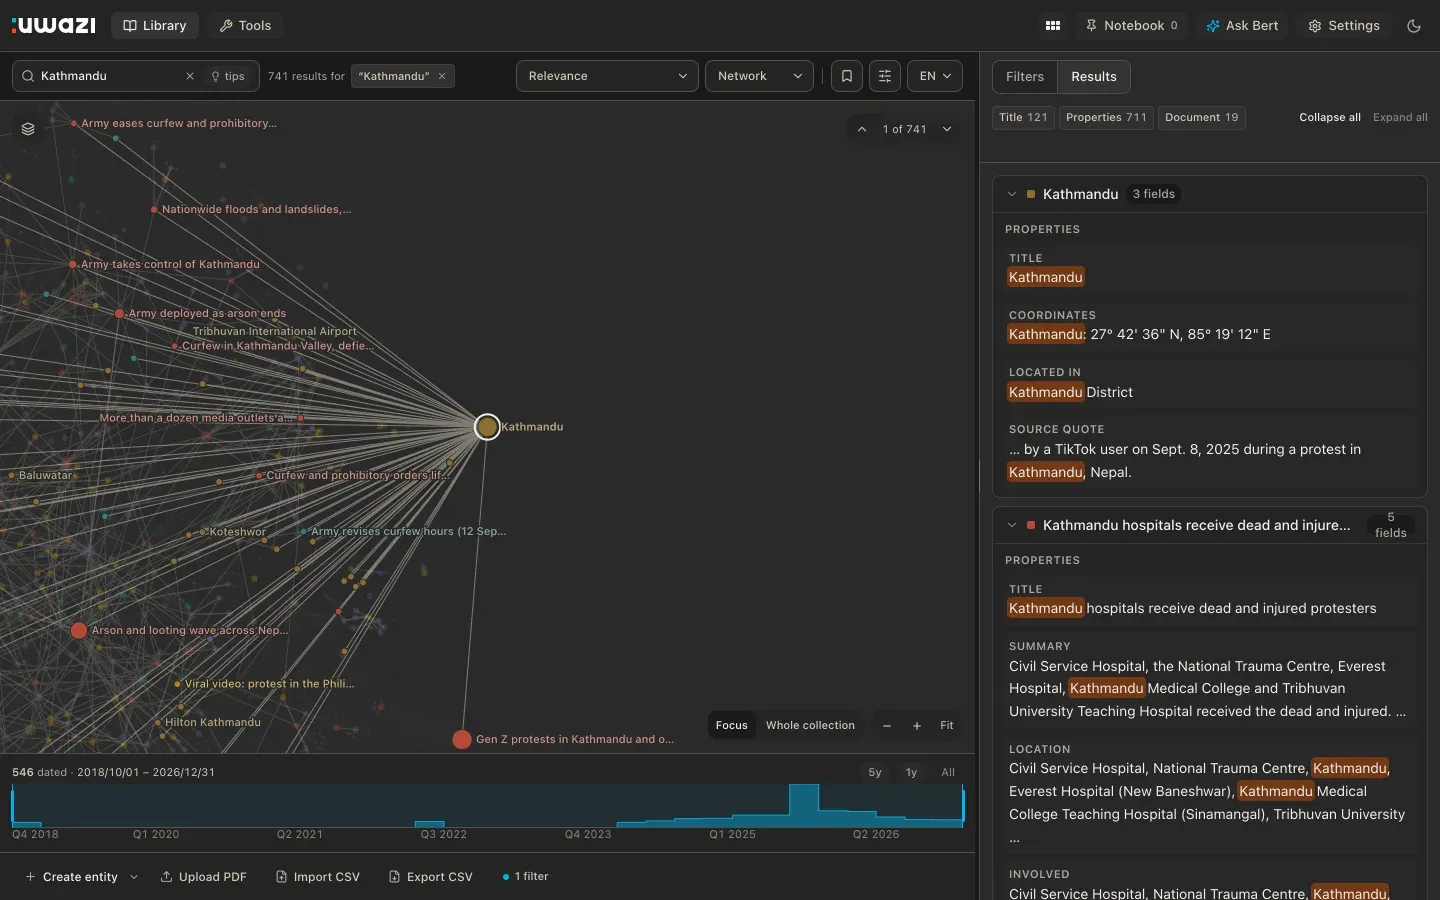
The whole collection is a Network: every record a dot, hover lifts its neighbours, an edge answers with its quotes and status, and a search flies to the best match and steps through the rest.
One clock
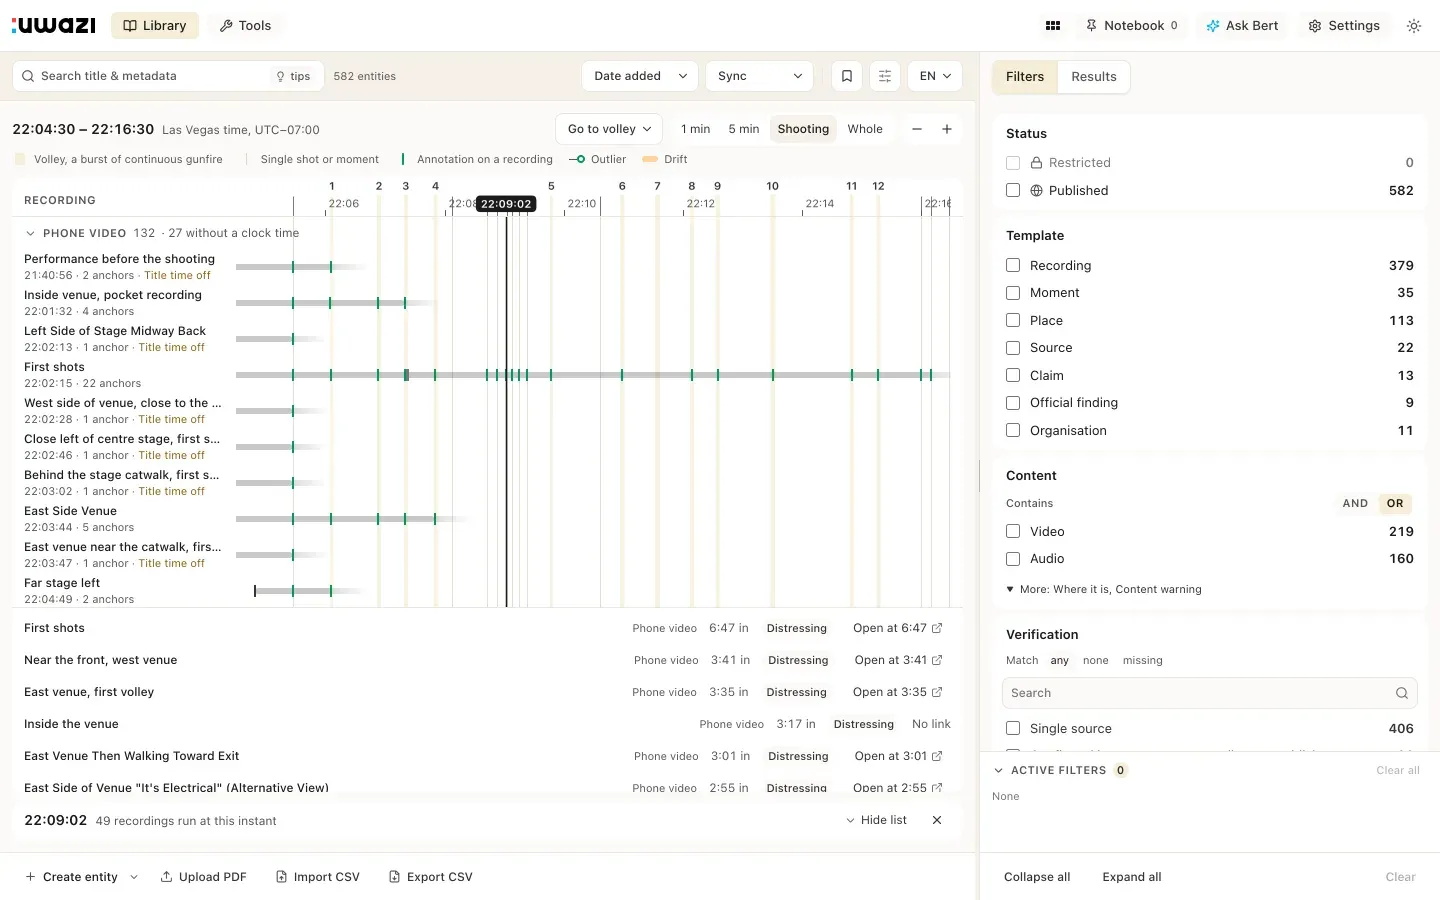
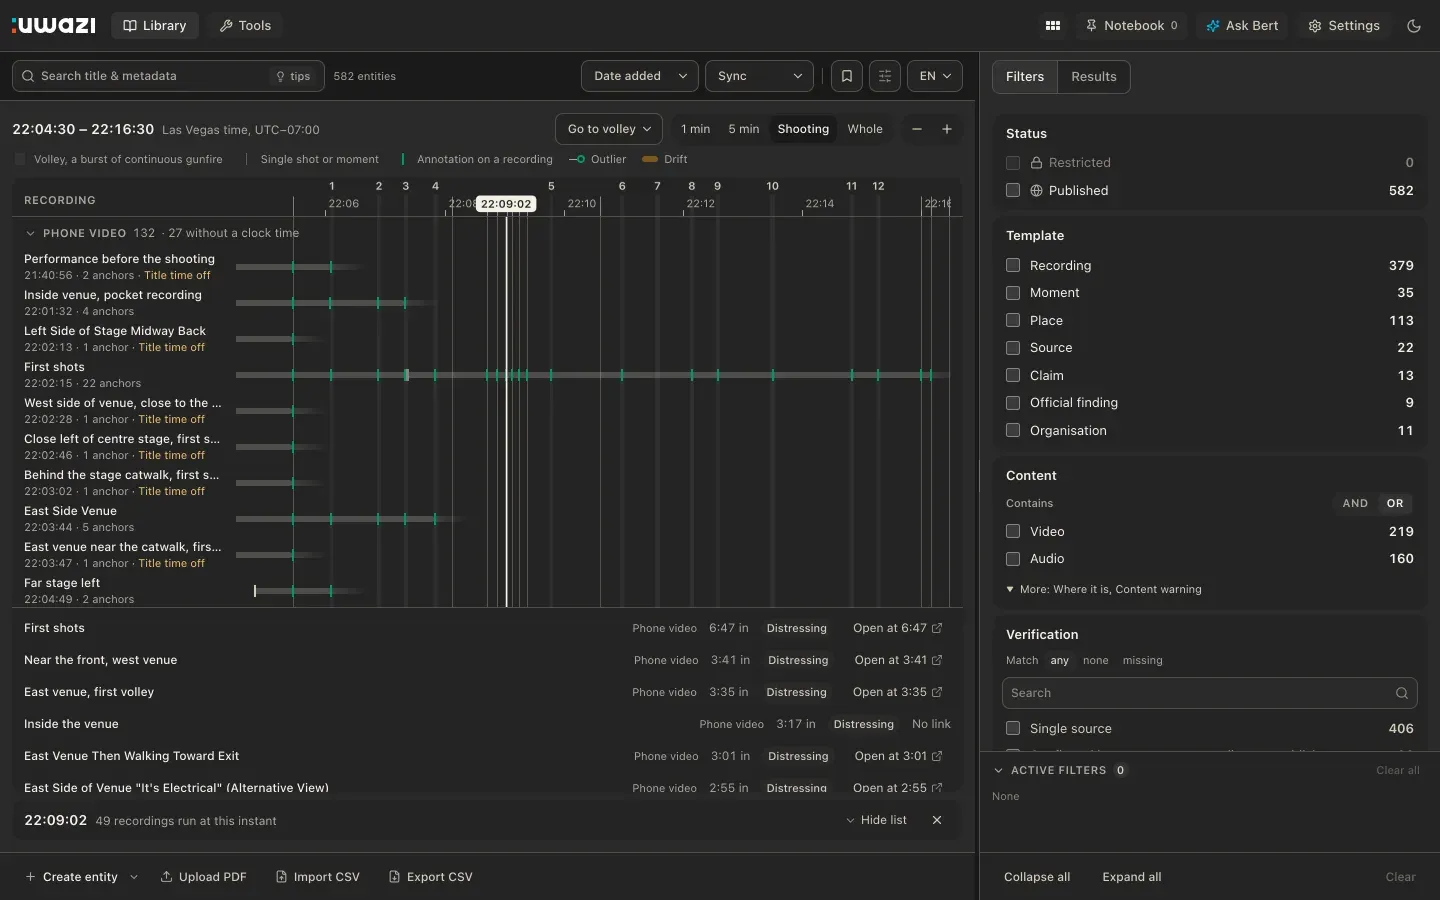
Some research is many recordings of the same minutes. The Sync view puts every recording of an event on one wall clock: phone videos, body cameras, dashcams and 911 calls as lanes, the bursts they share as the ticks that line them up. Click the clock and it lists what was running at that instant, and opens each recording at that second.
It also says how well a recording fits. An annotation that sits off the consensus time is an outlier, a lane whose clock wanders shows its drift, and a title time that does not match the first event is flagged rather than trusted.
The notebook
An investigation has to leave the tool. The Notebook pins records, holds notes, and builds a citation list from the pinned evidence: the quote, the publisher, the date, the URL, the status and the page. It exports as text, Markdown or CSV.
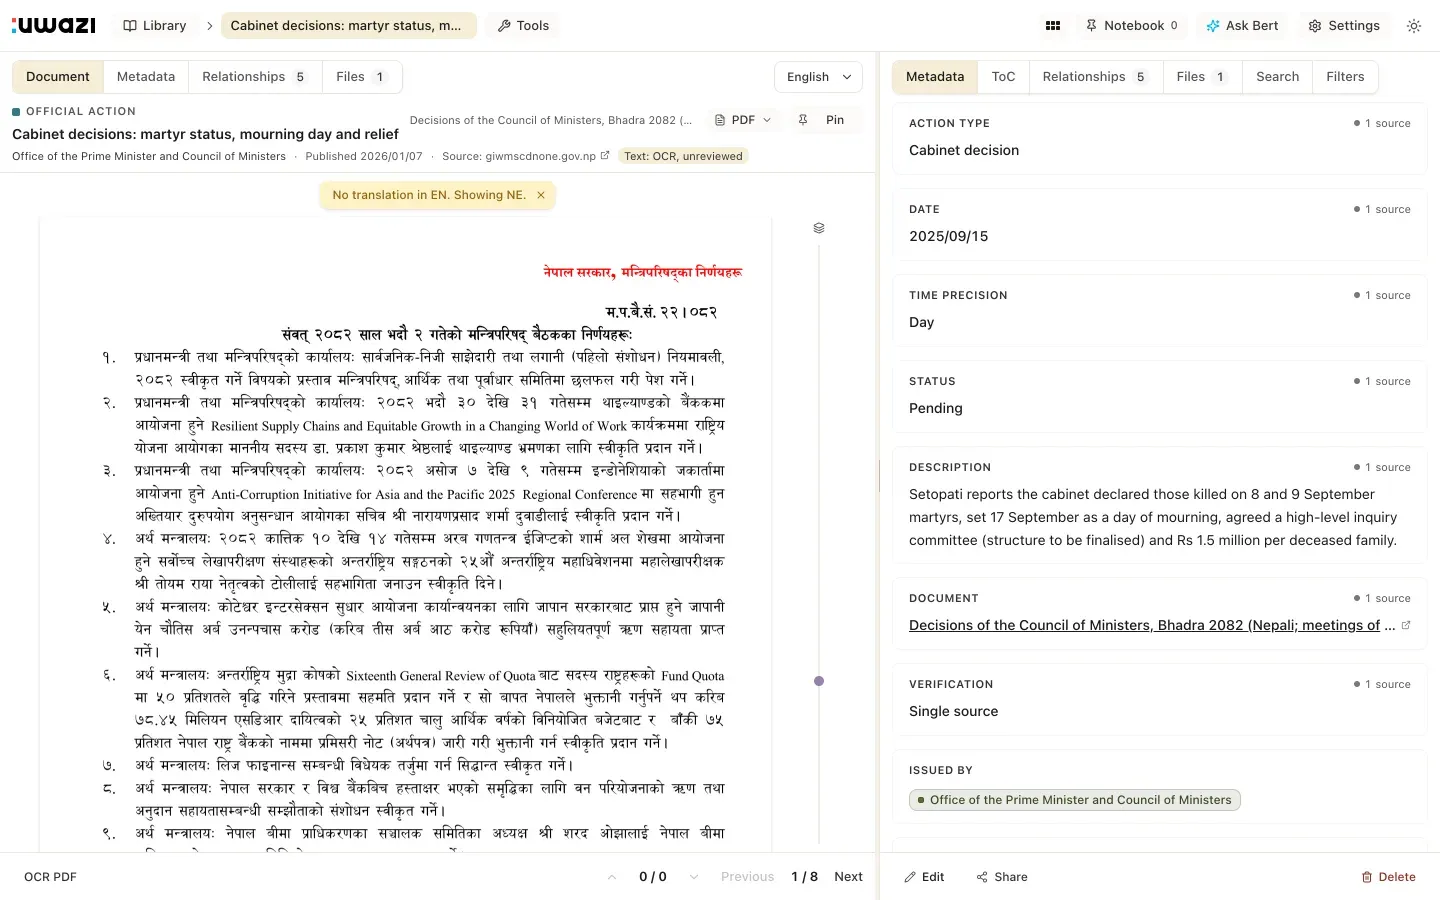
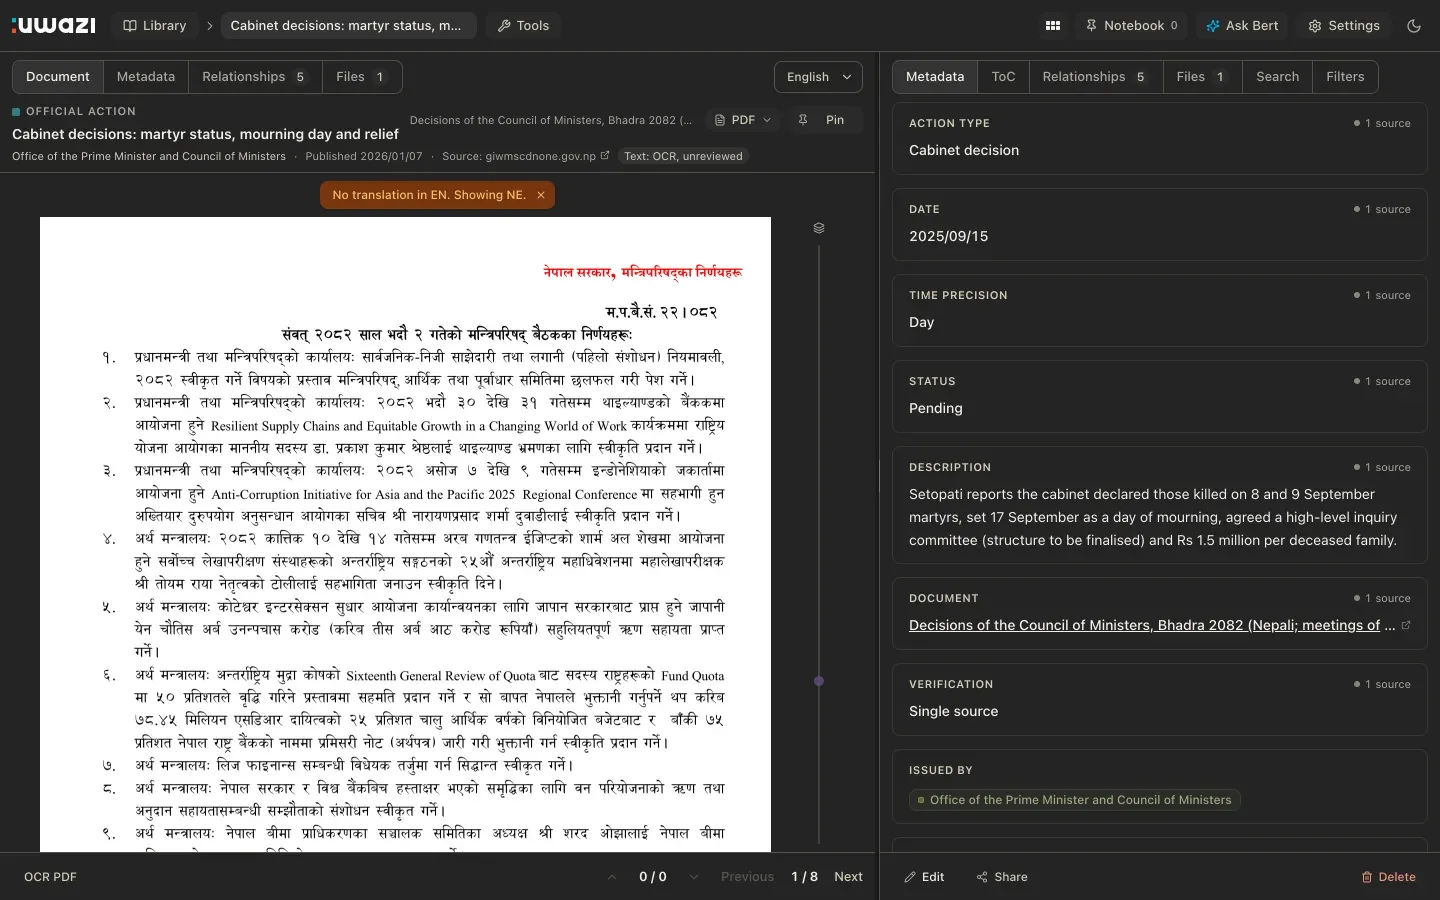
The sources are there too. Government documents sit in the collection as PDFs with their OCR text, marked unreviewed, with the issuer and the source under the header. A reference that cites page seven scrolls the document to page seven.
Not shipped
This is a prototype on mock data, with no backend, kept on a branch of its own. None of it is in the Uwazi that organisations run today, and whether any of it gets there is a decision for Huridocs, not for me.
It was tested on three collections built from public material. The Nepal protests of 2024 to 2026: 2,124 records, each fact with a verification status, 23 government PDFs and the claims, events and casualty records behind the September 2025 days. Las Vegas, 1 October 2017: 582 records, among them 132 phone videos and the 911 calls, timed to the second on one clock. And CEJIL's archive of the Inter-American human rights system, 4,398 records from 1986 to 2021, which is where the Network and the chain filters were first built.
The next questions are already on the list: annotating at the playhead, camera view cones on the map, a queue of contradictions to work through. They are not built, and I am not showing them as if they were.